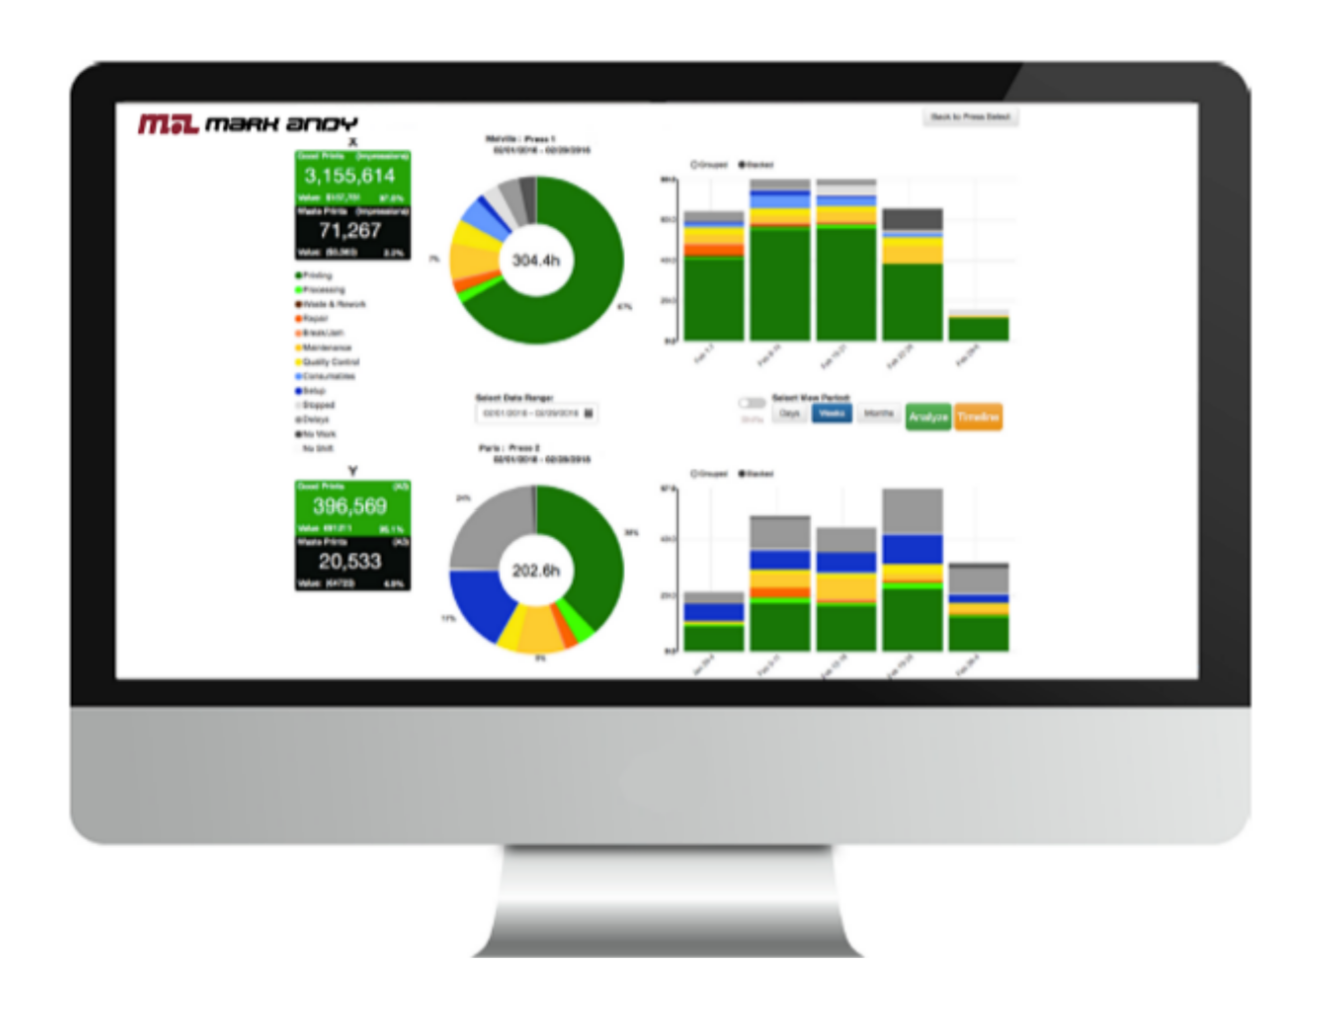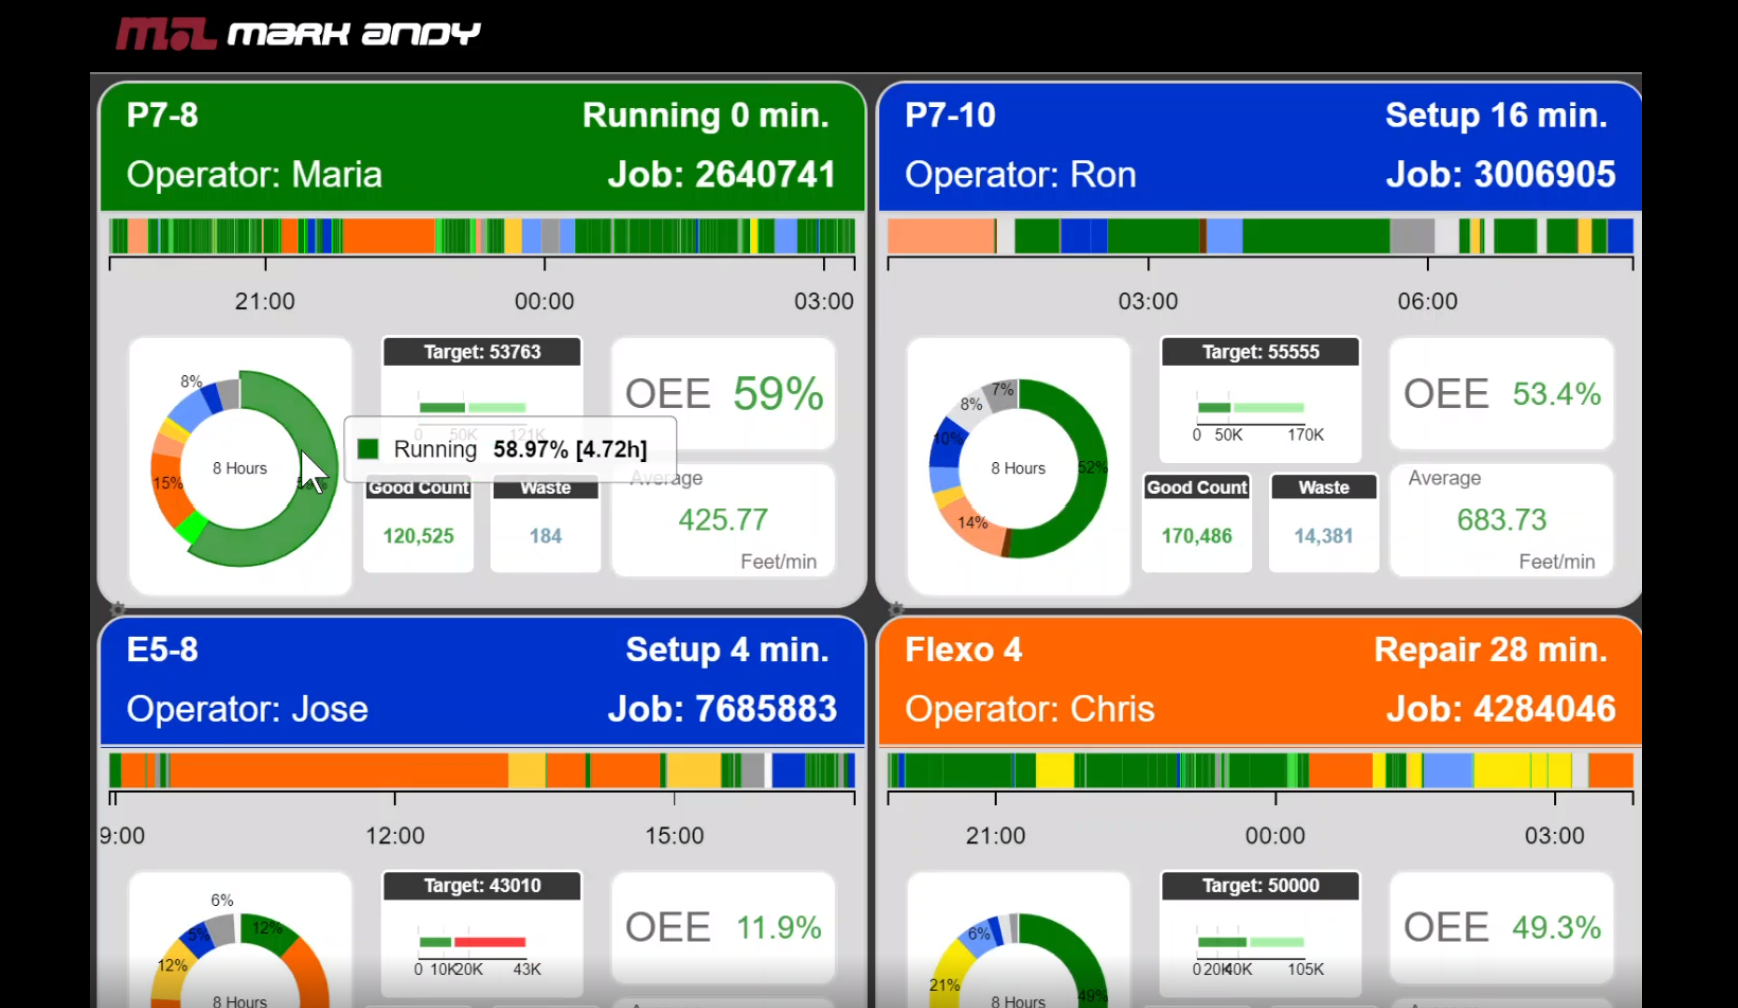
ProWORX Analytics is Mark Andy’s real-time, on-press monitoring system that gives operation managers a real-time look at what is happening on the press floor allowing them to make immediate adjustments that will reduce waste and errors and generate time and cost savings. sMArt link works with new and existing Mark Andy presses as well as other makes and models and can be accessed through a cloud-based platform.
Capabilities
-
Automatic data collection
Collects accurate production data directly from your machines
-
Multi-vendor
Supports various makes/models and technologies
-
Real-time monitoring and analytics
Cloud-based connectivity – monitors anytime, anywhere
-
Report generation
Reports opportunities for press optimization and more
Benefits
- Eliminates manual entries
- Saves operators’ time
- Easy and accurate production floor performance tracking
- Multi-vendor connectivity integrating the entire production flow
- Access to real-time actionable data and historical information
- Reveals immediate opportunities for:
- Press optimization
- Reduce Waste
- Improve job estimating
- Preventative maintenance initiatives
- Margin maximization
- Allows for data driven decision making
Download the Brochure to Learn More
With ProWORX Analytics the following is easily achievable:
Waste decrease
3% - 5%
Capacity increase
10% - 20%

5 to 30%
improvement in
productivity
Measure
Automate and collect data
from the production floor
Analyze
Monitor and analyze
activities in real-time to
identify opportunities
Improve
Implement controlled changes
for production performance and improved
profitability
Total Business Solution
ProWORX Analytics is part of Mark Andy’s overall sMArt platform that includes automated set-up, ease of operation and software integration. ProWORX Analytics builds on Mark Andy’s objective to enable converters to quickly, easily and cost effectively produce and finish labels & packaging on automated, robust, flexible equipment that adapts to changes over time.
ProWORX Analytics link FAQ's
Lot’s. With sensors and advanced integration, ProWORX Analytics collects accurate data on run speeds, up time, down time, waste and more. Combined with the robust analytics, you will be able to compare jobs, presses, operators or facilities and take action to improve overall effectiveness numbers.
Mark Andy has hundreds of sensors built into each press. The data collected from these sensors is presented in an easy to analyze way so you can understand how effectively the equipment is running. Access to dashboards and stored data provides valuable insight into what is working and what is not. Alarms can be set if press metrics are not being met giving supervisors an opportunity to make timely adjustments.
Data is collected 24/7 and is uploaded to an on-site server. From there, it can be viewed as dashboards on phones, tablets, or computers. Monitors can be displayed in the plant for real-time shop floor visibility. Data is pushed to the cloud where it can be accessed by anyone with an internet connection. Use this data to compare different presses, locations, timeframes, shifts or operators.
See where there are gaps in your process and make adjustments to reduce waste, increase uptime, run speeds and profits. Why is set-up taking longer than expected? Why does Press #2 always take longer to set up than Press #4? Why did we have less waste two months ago than we do now?

